Sunday, April 28, 2013

Visualization of Analytics on the Go: Incorporating Roambi into your Life


Visualization is key to conveying massive amounts of technical information quickly and effectively. A picture says a thousand words. What is better than seeing a picture, though? Interacting with the data. That is what Roambi is trying to provide for their users. As an interactive big data app, Roambi extracts data from businesses existing data intelligence system and then allows users to manipulate the data into a clear to understand visualization. A key feature of Roambi is its ability for you to create visualizations on the go, simply using your tablet. A year ago, Roambi had approximately 84,000 customers, and I imagine that number has grown as tablet usage has dramatically increased in the past year.
Roambi provides several different lines of business products to their customers. Roambi flow incorporates analytics with additional information (in text) to provide a more visually engaging experience for presentation. Roambi analytics provides real time information from your business intelligence system which allows you to create your mobile visualizations from data extracted from Salesforce, SAP, Oracle, IBM, and other databases.
By allowing users to manipulate their visualizations on the go, Roambi has tapped into unique market space. In my opinion, Roambi would have great value for consultants who are traveling and consistently working with a variety of people. Visualizations of large quantities of data can provide immediate credibility, which is key in the consulting industry. Although Roambi is a paid service, access to visualization on the go can be a pivotal part of selling a process or idea.
 Sources:
1. http://gigaom.com/2012/03/11/10-ways-big-data-is-changing-everything/10/
2. http://www.roambi.com/ 

Big Data for Big Knowledge in Supply Chain Management

Benefits of Big Data in Supply Chain
One of the areas which can be highly benefitted from the use of big data is supply chain management. As companies tend to place more focus on improving their customers’ overall experience rather than just focusing on the bottom line, big data can provide big insights. A recent article on supplychainbrain.com suggests that manufacturing now includes a service aspect, called “servitization.” This new portal of industry focus is requiring more information for operations departments, as it is causing an increase in the complexities of planning. This data must be available to key stakeholders in real time.
A significant aspect of this real time data is the use of shared data. As companies are expanding their ventures into big data territory, they are, with increasing frequency, sharing data across their corporation rather than just keeping it within one department. Cloud computing is allowing this trend to improve business decisions across multiple groups in the business. This allows for better end-to-end process collaboration.
A requirement for maximizing utility out of big data is having a flexible supply chain. If there is no flexibility in the current process, then what value can big data add to a company’s supply chain? The flexibility allows for quick changes which would affect their forecasts. By adding big data as a decision criterion for forecasting, companies are able to more accurately predict their demand based off of customer as well as company behavior.
In lieu of recent tragic global events such as weather phenomenon or violence, companies could use their big data to predict changes in the supply chain. By scanning through social media, weather, news, or other real time data outlets, they might be able to be proactive about changing suppliers, rerouting shipments, or changing production quantities. The future of flexible supply chain management could hinge on the successful application and integration of big data.
 
Sources:
1. http://www.supplychainbrain.com/content/technology-solutions/sales-operations-planning/single-article-page/article/the-big-data-imperative-in-forecasting-demand-planning/
2. http://www.scemagazine.com/big-data-driving-changes-in-supply-chain-management/

Tutorial: how to load the 1000 genomes data into Amazon Web Services

 The format of this tutorial is done such that it gives written instructions followed by a picture for that step.

Step 1.
Start by logging into AWS. Once you have done that, you will see this page. Click "EC2" virtual services in the cloud.
Step 2.
Click on "Launch Instance"

Step 3. The next page will say "launch with classic wizard." Just click "Continue."

Step 4. The next page will be titled "Request instances wizard." Just click "community AMIs tab".

Step 5. Next to the Viewing all images drop down field, type in"1000HumanGenomes."

Step 6. Once the AMIs have popped up, click select next to the first one.


Step 7. After that you will be taken to the instance types selection. Click the drop down arrow and select the type of instance you would like to use. I chose "M1 Large."

Step 8. Next you will be prompted to create a password in order to access your AMI. Type your password in the text field shown in the picture.


Step 9. Next you will be prompted with a "Storage device configuration" menu. Just click continue.

Step 10. It will ask you if you want to tag your instance. You can just click continue.


Step 11.

Next you will be prompted to enter your personal key pair. Enter your keypair into the text field marked in the photo.


Step 12.  Next, you will be prompted to enter your security group. Just select the default one.


Step 13. In  Step 13 you will be shown all the specifics you requested in the previous steps. Click Launch if they are all satisfactory.


Step 14. After that, you will be told that your instance is being launched. Click "close."


Step 15. In your instances section, check the Status Checks section. After a while, it should say "checks past."


Step 16.  After that, you are done. If you have a piece of software called Linux bio cloud on a computer with a Ubuntu Linux operating system, you should be able to work with the data!


Saturday, April 27, 2013

Counter-terrorism using Data Mining

Boston marathon bombings terrorized the country.  Shortly after the bombings, FBI looked into mining of data to narrow down on the suspects. The FBI team analyzed 10 TB of data such as cell phone tower call logs, text messages, social media data, photos and videos from surveillance videos and additional photos and videos from general public who were present at the marathon. Twitter data was also analyzed with the help of a company called Topsy Labs which is a repository of tweets from the year 2010 and the location of origin of tweets. Data was analyzed not only few days before the bombings but also billions of tweets related to Boston and its suburbs. This humongous data was analyzed using FBI's software and common tools such as face-recognition and position triangulation. Even though mining of this data didn't lead to the capture of the suspect Dzhokhar Tsarnaev, it shows what data mining is an effective tool for counter-terrorism. In the future, by developing a model and using the features of Artificial Intelligence terrorism can be reduced to the maximum. In the future, just like the movie "Minority Report" where the precogs predict the crime, supercomputers can be made to analyze data from satellite images, drone video feeds, photos and videos uploaded by users in YouTube, Facebook, Twitter and other social media to predict a crime.
Predictive analysis seems to be the future of counter-terrorism.

Reference: http://fcw.com/Articles/2013/04/26/big-data-boston-bomb-probe.aspx?Page=1

Google search and the stock market - Google Trends Strategy

By mining Google search terms over a span of eight years, researchers of Warwick Business School, University College London and Boston University say that early signs of stock market fluctuation can be predicted to buy or sell stocks. They analyzed Google search by users of financial  terms and an investment strategy   was developed. These search terms were analyzed on a weekly basis and buying or selling of shares was done accordingly. They would open up a hypothetical short position if the volume of search terms went up in the a week and sell it the next week. They bought it if there was a decrease in volume of the search terms considered. This strategy yielded a return of 326 percent return which is almost twenty times more than that of the conventional strategy. With this strategy, stock market trends can be predicted and it might give a whole new level of experience for potential investors and for people playing with numbers.

A Facebook user profile through Big Data

A research by a computational knowledge engine shows how people meet and how their life works by analyzing friend and relationship status in Facebook. The research was volunteered by more than a million Facebook users on Wolfram's site. Wolfram research analyzes each and every activity of a user and used it to generate reports for the activity of users in United States.
 Reports can be generated for each Facebook user and these reports are amazing. Word cloud, relationship status of friends, distribution of friends' ages, friend network and many other fascinating reports could be generated. Friend clusters are made and friends are classified into social insiders (a friend who share a large number of friends), social outsiders(a friend who shares at most one friend), top social connectors(a friend who connects together group of friends who are otherwise disconnected), top social neighbors(a friend with small number of out-of-network friends - friends of theirs that we don't know) and top social gateways (a friend with large number of out-of-network friends). Basically terms are coined by using graph theory.
These are some of the screenshots from my (Robin Muthukumar) report

My activity in Facebook

Friends network

Color coded friends network

Each user can get his/her own report by using this link http://www.wolframalpha.com/facebook/
Data like these were analyzed and compared to the United States census data and both were found to be identical. This kind of research help the Government to monitor people's mindset and pass bills or amend laws accordingly. This kind of research helps politicians to gather their votes. 

Advertisements and their impact on Facebook users

After being skeptical about web advertising, Yahoo! followed web advertising to make money out of the web. A more refined method of web advertising was used by Google to make more money out of it.
A study about web advertising in Facebook by a team at Facebook shows that merely the presence of an ad in Facebook has an influence on the users. Two data sets were compared. One was the number of users clicking the ad in Facebook. Second data set is the purchasing pattern from an analyst firm Datalogix. On comparison, the people at Facebook and Datalogix observed that  the presence of an ad makes users buy the product even if they don’t click on it. According to Rick Robinson a freelance writer "Big Data analytics show that mere exposure to Facebook ads does indeed influences users' purchasing patterns." Facebook suggests ads based on the likes and interests of the user. So it is evident that web advertising has an upper hand in determining the sales of a product than conventional advertising methods. This shows the power of web advertising over conventional methods.

Reference: 
http://midsizeinsider.com/en-us/article/big-data-analytics-takes-web-advertising

Tutorial: Motion Chart on African Nations


I have looked further into the visualization of GDP per capita versus percent GDP spent on military I created earlier in the semester and wanted to write a quick tutorial on how I altered the Google spreadsheet in order to focus on African nations and what this chart reveals about that continent.  

The first step was quite simple but time consuming. I had to go through the data and delete the data on 95 different nations to leave 35 remaining African countries that had sufficient data.


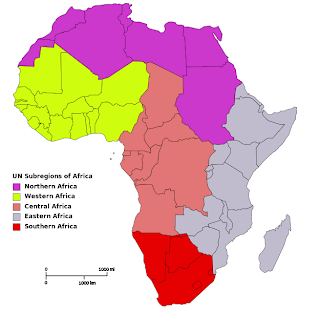
 Next I separated the 35 nations into the five UN geographical sub-regions: Northern, Western, Central, Southern, and Eastern.


After grouping the nations under these regions and gave each region a numerical value so I could distinguish them by color on the motion chart.

Northern (1), Western (2), Central (3), Southern (4), Western (5)


When finished, simply select “Insert”, then “Chart”, “Charts”, “Trend”, then finally the image of a motion chart to the right of Trend. Select “Insert” and the chart will be inserted onto your tab containing your data. If you select the drop box at the upper right hand corner of the chart, you can then select “Move to own sheet,” that way you don’t have to move the chart around to look at your data. 


Once the chart is created, select the “Color” drop box and select “Region.” This will color coordinate the nations based on the regions in which they are located.  Then select the “Size” drop box and select “Population.” This will obviously base the size of the nation indicators on the population of the nation.


Now just press the play button in the bottom left corner of the chart and watch the motion chart at work.


Data from WorldBank

Thursday, April 25, 2013

Visualization Project: Blog Plagiarism

Visualization Project: Plagiarism (Google API)
Team: Greg Adams, Alex Lee, Andrew Smith

Now, nobody go and repost this and claim it as their own ;)

Titanic Competition Using BigML

We used BigML to compete in the Titanic DM competition on Kaggle. Team members: Andrew J. Smith, Greg Adams, Alex Lee, Chelsea McMeen

Digit Recognizer

Team members: Greg Adams, Drew Smith, Alex Lee, Chelsea McMeen

 We wrote a Matlab program for the digit Recognizer competition. This is a video that explains how we tackled this competition.


Product review mining


I read some papers and post these days about product review mining. I want share some ideas of mining I summarized. 

First, This mining is a kind of text mining.The review mining also call opinion mining. The researchers want find what are the reviewer's opinions on products, either negative or positive. 

The review mining do not focus on the ratings, such as product rating on amazon. This mining focuses on the text written by customers or professional reviewer. Certainly, the mining result is helpful for producer to improve products. If the reviews are classified by "cons" or "pros" automatically, such as Newegg.com's review, it is much easier to mining. 

The mining is to find feature words, and then based on the number of feature words, measurement scores are calculated. 

Feature words could represent customer opinion directly. For example, if customers say "awesome", "excellent", these words show their positive opinions. But if they say, "bad", "s***", negative opinions are shown. Also some feature words are depend on different products, for instance, most customer need a quiet computer case, so "quiet", "no sound" are good for computer cases, but for stereos, these words are negative. 

To find the feature word is regular text mining. After searching the feature word, some evaluation method are developed to decide whether the comment is negative or positive  The snip below is used ref-3, the SO value is standard whether this positive or negative. 


Ref:
1. http://www.slideshare.net/felipemattosinho/mining-product-opinions-and-reviews-on-the-web
2. Movie Review Mining and Summarization, DOI: 10.1145/1183614.1183625
3. Movie Review Mining: a Comparison between Supervised and Unsupervised Classification Approaches, DOI: 10.1109/HICSS.2005.445

Wednesday, April 24, 2013

Privacy in the Big Data era

We already have mountains of information in a variety of forms of data, such as plain texts in social media, spreadsheet form data about patients, and massive database provided publicly. When this kind of data is used, de-identification has been very crucial in order to prevent individuals from being victims of identity theft or from involving other type of crime. However, as the power of data processing drastically improves, re-identification is not impossible by analyzing the pattern of individuals' behavior. It seems very natural that many people concern the danger of development of big data technology.

Here is a paper that delivers the authors' thoughts on privacy in the Big Data time. 

Big Data: Big Benefits

Google Flu Trends is a good example that can show the benefit of Big Data. It provides a service that predicts and locates outbreaks of the flu by making use of information - aggregate search engines. This service, early detection of disease, when followed by rapid response, can reduce the impact of both seasonal and pandemic influenza.

Traffic management and control is a field witnessing significant data-driven environmental innovation. By using electronic toll pricing systems, drivers pay depending on their use of vehicles and roads. Also, this management and control enables governments to potentially cut congestion and the emission of pollutants.

Big Data: Big Concerns

However, the harvesting of large data sets and the use of analytics implicate privacy concerns. Ensuring data security and protecting privacy become harder as information is multiplied and shared ever more widely around the world. If de-identification becomes a key component of business models, most notably in the contexts of health data, online behavioral advertising, and cloud computing, governments and businesses could be in more trouble.

What data is "Personal?"

It seems that there is no common idea even in the group of law scholars. Quoted Betsy Masiello and Alma Whitten, 
"anonymized information will always carry some risk of re-identification. many of the most pressing privacy risks exist only if there is certainty in re-idenfication, that is if the information can be authenticated. As uncertainty is introduced into the re-identification equation, we cannot know that the information truly corresponds to a particular individual; it becomes more anonymous as larger amounts of uncertainty are introduced."

The authors did not present some tangible conclusion. Of course, this debate will be continuing. I think that the obvious thing on this debate is that attempts to harvest privacy data will be existing and counteraction against the attempts will also be deploying.

Reference: http://www.stanfordlawreview.org/online/privacy-paradox/big-data

Tuesday, April 23, 2013

Selection Bias in the NHL Draft

It has been a long standing practice in the National Hockey League to value slightly older players in the NHL draft.  Relative Age Effect occurs when people who are relatively older than the rest of their peers for their age group are more likely to succeed.  This phenomenon has been observed to reliably to occur in certain educational and athletic settings.  A group of psychology professors have discovered that NHL teams have been biased towards slightly older players in the NHL draft.  The research has shown that players that are born in the first three months of the year (relatively younger) are more likely to succeed in the NHL.  The study looked at twenty-seven years of data from the NHL and found that relatively younger players have a much longer career.  In the study they discovered that players who were born in between July and December accounted for 34% of the players drafted, but these players played in 42% of games, as well scored 44% of all the points.  On the other hand, players who were born from January to March accounted for 36% of the players drafted, but only accounted for only 25% of the points and only played in 28% of the games.  This discovery seems very odd to me.  It doesn't seem like which part of the year you were born in would have a substantial effect on your career in the NHL.  Also, this finding is in contrast with most other studies about Relative Age Effects, which state that relatively older individuals are more likely to succeed.  Another study showed that most of the top prospects (40%) in the Canadian youth hockey leagues were born in the first three months of the year, while only 15% were born in the later part of the year.  The study says they are not sure why this phenomenon had been occurring, just that it is an interesting finding and should merit further research and study.  I found this study to be very interesting, who knew that what part of the year you were born in would affect how well you preformed in a sport.

Sources:

http://www.plosone.org/article/info%3Adoi%2F10.1371%2Fjournal.pone.0057753#abstract0

http://www.wired.com/playbook/2013/03/nhl-selection-bias/

Recommendation Algorithms

This is the day and age for recommendation algorithms. With such a diverse and seemingly infinitely large market, there is much room for a consultant that can tell you what you want. One really good example of a company that already uses a really well designed algorithm is Netflix. They effectively narrow down a list of thousands and thousands of movies and select a list of ten that you will most likely enjoy watching. It is actually quite scary, and by scary I mean correct, what solutions that they come up with. But why a list of ten? Wouldn't a perfect recommendation just be one thing, the thing you wanted to watch. One company, Stitch Fix, has done exactly this in the domain of apparel. This companies owner Eric Colson explains their business model in this video:


Weeding out the noise


While studying Big data, one might misinterpret how data mining works. You first must understand that information does not equal insight. While insight always entails information, information does not always entail insight. Dr. Michael Wu explains 3 criteria for information to provide valuable insights. 
1. Interpretability. Because big data can be so unstructured and diverse there is a large amount of data that can be uninterpreted. 
For example, consider this sequence of numbers: 123, 243, 187, 89, and 156. This data could mean a number of things. (Street addresses, the total minutes it takes to write a blog, number of candies in a bag) The point that Dr. Wu is making with this criteria is that, without the metadata to describe this data further you are unable to interpret and therefore cannot gain any insight from it. 
2. Relevance. Information must be relevant in order for it to be of any use. Relevant info is sometimes referred to as a signal whereas irrelevant information is referred to as noise. But relevance is a very relative term. "Information that is relevant to me may be completely irrelevant to you, and vice versa. Relevance is not only subjective, it is also contextual. If I’m visiting NYC next week, then NYC traffic will suddenly become very relevant to me. But after I return to Alabama, the same information will instantly become irrelevant again."
.3. Novelty. Information must be novel, meaning that this information is new and does not tell you something that you already know.
Clearly this criteria is also very relative. It is quite obvious that something I know as old, you might find out as new, and something that i might find insightful you might not. 

Big Data in Logistics


source: http://www.oracle.com/us/corporate/profit/opinion/021512-sswaminathan-1523937.html

Big data has shown that it can change an industry and it proves to do the same for third party logistics. So what does logistics mean? Logistics can mean a lot of things. Mainly it contains the section of supply chain management business that controls, implements and plans the transportation of goods and its efficiency in doing it. It also accounts for the storage of items and goods and services between salesmen and customers.  Big data gives shippers, 3PLs (third party logistics), and carriers a whole new advantage over their market. Companies that use big data in the correct ways will get increased visibility of future opportunities.

Below are some ideas and applications of Big Data analytics in Logistics:

  Source

  Opportunity
  Weblogs
  Patterns that customers show when shopping at certain times of the year 
 
  Trailer tags 
   Insight into the times of which trucks arrive/leave and finding reasons for delay
 
  Pallet/Case/SKU
  tags
 
   Insight into the times of which packages arrive/leave and finding reasons for delay
 
 Electronic on-board recorder 
   Insights into travel times, load/unload times, and driver hours
 
  Mobile devices 
   Insights into mobile application usage by customers, partners, and employees
 
  Social platforms 
   Customer insight —who “likes” your products, who has advocated your products, 
    who has issues, and what their issues are


Machine Learning and Online Fraud


We all know that data mining has many extremely useful applications as this blog discusses a variety of them. In looking to expand my knowledge on the subject, I always look for topics on data mining different than the ones we discuss in class, one being using machine learning techniques to combat online fraudulence. The article states that most algorithms designed to detect fraudulence follow anywhere from 175 to 225 questions or rules. Like the rest of the world, those committing fraud are constantly changing and evolving, which does not present any good news to those trying to prevent it from happening. Ex-Google employees consequently sought to develop a new approach that would detect fraud before it occurs. They have developed the Sift system which actively applies to sites, creating millions of connections of fraudulent behaviors. New insights are already being developed as a result of this new tool. Such insights include but are not limited to the statistic that Yahoo users are five times more likely to create a fake email account than those that use G-mail.

More effective data mining as a result of machine learning will soon, if not already, out-perform existing agencies looking to detect fraudulent practices. Though these traditional techniques have worked in the past, the constant barage of information uploaded to the web will soon allow many criminals to fall through the cracks. Teaching a machine to essentially question online users based on individual activities will revolutionize the detection process, and hopefully deter hackers from trying to manipulate the internet, decreasing online fraud altogether. This will be especially useful to government agencies as well. It only makes sense that hackers continually change and adapt in order to remain anonymous. Previous systems designed to protect the public from fraudulence are adapting at a pace must slower than hackers. Consequently, fraudulence is not going anywhere. This Sift system is a huge break through in machine learning because it utilizes the predictive capabilities of the concept in way that can save the United States alone hundreds of millions of dollars a year as well as banks and the general public.

Link to article:
http://gcn.com/Articles/2013/03/26/Sift-Science-machine-learning-anti-fraud.aspx?Page=1

The Future of Data Mining - "Fast Data"


Firstly, here are sum statistics from the article I read for this particular blog post:
  • Every minute:
    • 48 HOURS of video are uploaded on Youtube
    • 204 million e-mails are sent
    • 600 new websites pop up
    • 600,000 pieces of content are shared on Facebook
    • Upwards of 100,000 tweets are sent

This article stresses the idea that data mining is time. Author Alissa Lorentz states that we must be able to mine data as quickly as we produce it. Because the of the plethora of electronic information available today, data mining is extremely important and an issue or concept of which I was previously not aware. Lorentz discusses the difference between smart data, data that provides insight to large data sets and big data, which is a term we apply to extremely large data sets. She then elaborates on a concept she calls "fast data." Fast data will eventually be extremely useful. It analyzes data sets in real time. If one were able to analyze all of the data available on a specific company in any given day in a meaningful way, let's just say I'd be looking at the stock market.

In class, we have discussed mainly archiving data, organizing data in a historical sense. This article discusses a different concept: streaming data i.e. streaming data live rather than storing it for future use. To me, this is ideal. Rather than storing messages on Facebook, providing users with a list compiled of a certain amount of friends that have recently been in contact on the social network would save memory and computing powers as well as be more useful to the user who has messages from conversations years ago. Also, in applying this concept to other situations, Lorentz talks about how streaming data would provide important information on traffic or public health issues such as flu outbreaks. With the abundance of information that is constantly being added to the web, storing and archiving this information will undoubtedly become obsolete. Instead of focusing on analyzing past data, after reading this article, I think the best direction in the data mining world would be to chase the data rather than store it. Updating data sets in real time would not only eliminate the need for large storage systems, but it would better indicate the trends occurring in the here and now. 


Link to article:
http://www.wired.com/insights/2013/04/big-data-fast-data-smart-data/

Kaggle Project


Wilson and I completed the Kaggle Project on the Titanic and machine learning, similar to the presentation today in class. We uploaded a video to YouTube explaining our approach. We utilized both Excel and Python to obtain a model which predicts whether a passenger will survive or not based on machine learning principles learned in class. The link is posted below.

http://www.youtube.com/watch?v=WqousZZSLFs